Reporting Metrics and Identifying TrendsFinally, you have set up your defect repository, trained everyone on it, set up and are running your triage meetings. So now you just need to report on the results of defect management within your organization. How best to do that? Well, we need to answer a couple of questions first.
I think once these questions are answered, you will have a full picture of why you want to add this powerful tool to your arsenal of defect management. 1. What is your goal in sending out these metrics?Actually, this has a fairly simple answer: it is to inform and improve, or rather to inform IN ORDER to improve. You goal is to send out information to key decision makers about the progress of the application development efforts as reflected in the resolution of the defects being found during testing. You are doing this so that they have the chance to "nip in the bud" any issues that are being exposed by the presentation of the data. By presenting to them the defect data in an easily digestible form, either snapshots of data as it exists today or as it has progressed (positively or negatively) over time, you are giving them information they need to identify and address issues, fix processes or at least call out weak parts of the development process so that the right people can begin to address a resolution. 2. Who is your audience for these metrics?Generally, as indicated above, your main audience is the Sr. Management who can make decisions to change process and fix issues within the development lifecycle. However, you do have other audiences for specific metrics.
3. How, and how often should you distribute metrics?There are two times to distribute metrics that would not be a surprise to you - daily and weekly. However, I would say that this also is dependent on your audience. For instance, for your Sr. Management and probably your department heads, you should be reporting everything we talk about in the next item (#4), but to your Dev team and Test team, you might want to not overwhelm them with details and only send out their metrics on a weekly basis. Metrics need to go out to the decision makers, the people with the ability act on negative trends quickly, every day. If you wait until the end of the week, any trends that have been presenting themselves throughout the week may be more difficult to resolve. As to how to distribute them, there are multiple ways. You should present them to your audience(s) to get their feedback. They might include:
4. What should you be presenting to your audience?Here is the meat of the blog - WHAT metrics are you actually creating and sharing with your audience(s)? This actually goes way back to the second blog in this series - setting up your defect repository correctly in the beginning, making sure you are capturing the information you need in order to report meaningful metrics to those in charge. Below are some ideas of what you might present to all parties interested to get their feedback as to what they actually want to see. In some cases, they will be blown away by your list of options, in others they may want to see other metrics. This is why, way back in blog #2, I suggested thinking ahead on this, with the following: "SO, now you have wracked your brain on fields you think you might need, it is time for you (if you haven't already) to talk to the business owners and other Sr. Management, asking THEM what they want to see, the data they want to capture, what reports and charts will be of interest and use for them. This may be department specific, for their department, or specific to the company, or simply a need that this particular department head has. I would suggest that you have a list of tables/charts ready for them so that you can give examples of metrics you can deliver, and what they would look like. This may guide them into selecting metrics that you know are valuable, and may also spark ideas in their heads on other metrics they might want to see." What do you need to think about when creating your metrics? Some things to think about are:
Note that for any given metric not ALL of these need to be true, merely that you want to think about this list when you are developing a metric to see if that metric checks one or more of these boxes. Most metrics for defects will fit one of the following types:
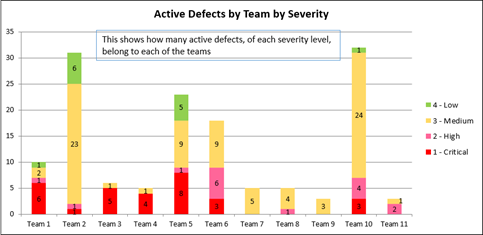
Here are some examples of common defect metrics. By no means a comprehensive list, just some ideas to start your brain thinking: A basic type - Count how many defects of what Severity are open by each Team. That is, show me the teams that are having the most difficulty. So below we see that Teams 2 and 10 have the MOST open defects that belong to them, but most are of Medium Severity. However Teams 1 and 5 have the most CRITICAL Severity, Teams 5 and 6 have the most Critical and High Severity open defects.
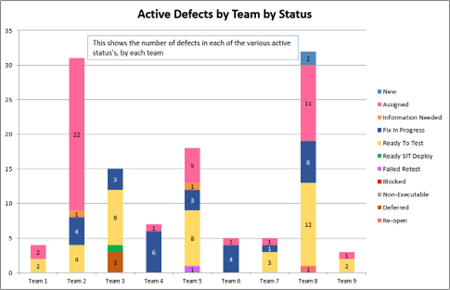
So, very similar to the last one, we have the Teams at the bottom, and the counts are of Defect Status for each Team. This might answer the question of which team has the most defects still not started ("Assigned" rather than "Fix in Progress", for instance) (Team 2), and which team has the most defect sitting there, waiting to be tested ("Ready to Test") (Team 8, followed by Teams 3 and 5).
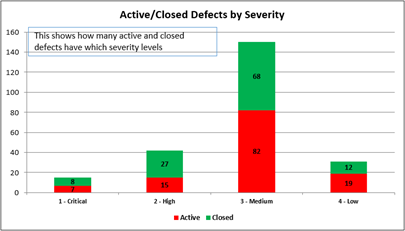
Simply the count of Open and Closed defects by Severity, showing us that MOST of our defects are only of Medium Severity, and that about half of our defects are still open.
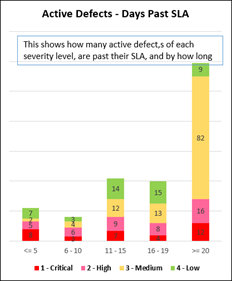
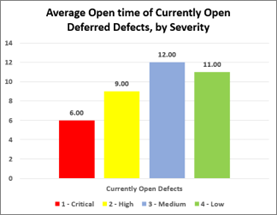
For this we are looking at how many defects, of what Severity, are how many days past the agreed upon SLA. If ALL defects were fixed within their SLA, this chart would be blank. However this shows that there are a LOT of defects that are 11 days or more past their SLA, and that the oldest defects just keep stacking up, are not being addressed and closed.
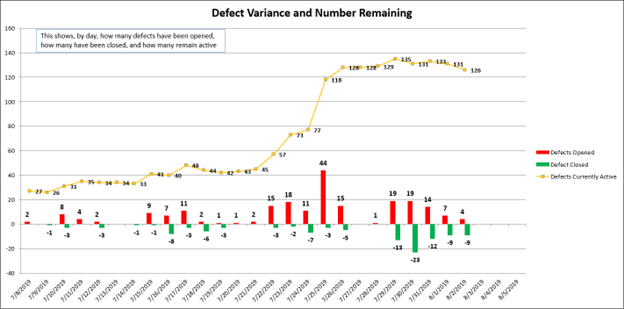
Following is a very informative chart, counting how many defects are open or closed each day, and the number of open defects remaining. This shows that more defects are being opened than closed each day, and so the number of open defects just keeps going up.
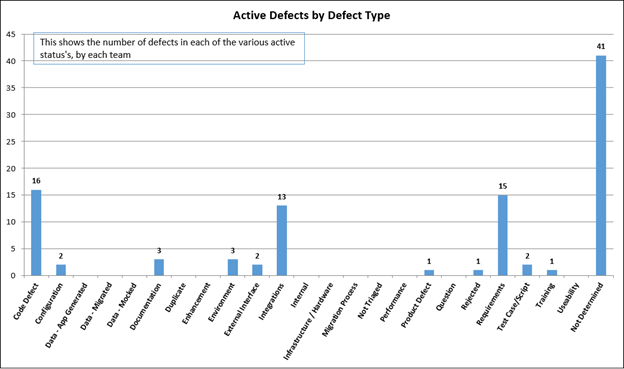
Below we are counting the number of defects by the determined or suspected defect TYPE. This would inform us WHERE in the process is causing the most defects. In this case, you can see that the Requirement Gathering, the Coding, and the Data Integration processes seem to have lots of room for improvements that could be researched. However, you might also notice that, by far, most defects have not even had a determination made as to the cause of the defect. THIS shows a need for process improvement on filling out defects, or on how best to determine what caused the defect.
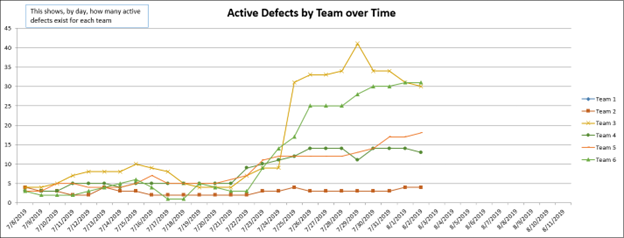
This is another set of data over time, showing, by team, how defects are assigned to each team day by day. This particularly showing that Teams 3 and 6 had a spike of defects and continue to have the most open defects, and that Team 2 has continually maintained only a small number of open defects.
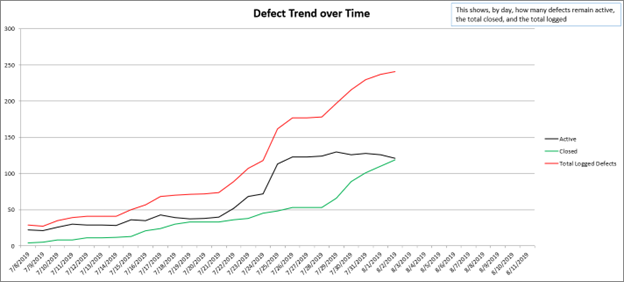
Another one over the time period of the testing effort, this simplifies the data to simply say we have this many Open defects each day, this many Closed defects, increasing everyday (as more and more defects are fixed and closed), with the goal of eventually meeting up with the third line, the total number of defects that have been logged to date.
A simple one again, this simply counts the number of currently open defects (as of the socialization of this chart), broken by their Severity.
These are just a handful of the many different charts of data you can display. Keep in mind that:
So, there it is - Reporting Metrics and Identifying Trends in a nutshell. Determine WHY you are creating metrics, WHO needs to see them, HOW OFTEN they need to be sent out, and WHAT you should be creating for your audience. That wraps up the entire Defect Management set of blogs. I hope you have enjoyed them and learned from them so that you feel more comfortable instituting good Defect Management practices and processes within your own organization.
|